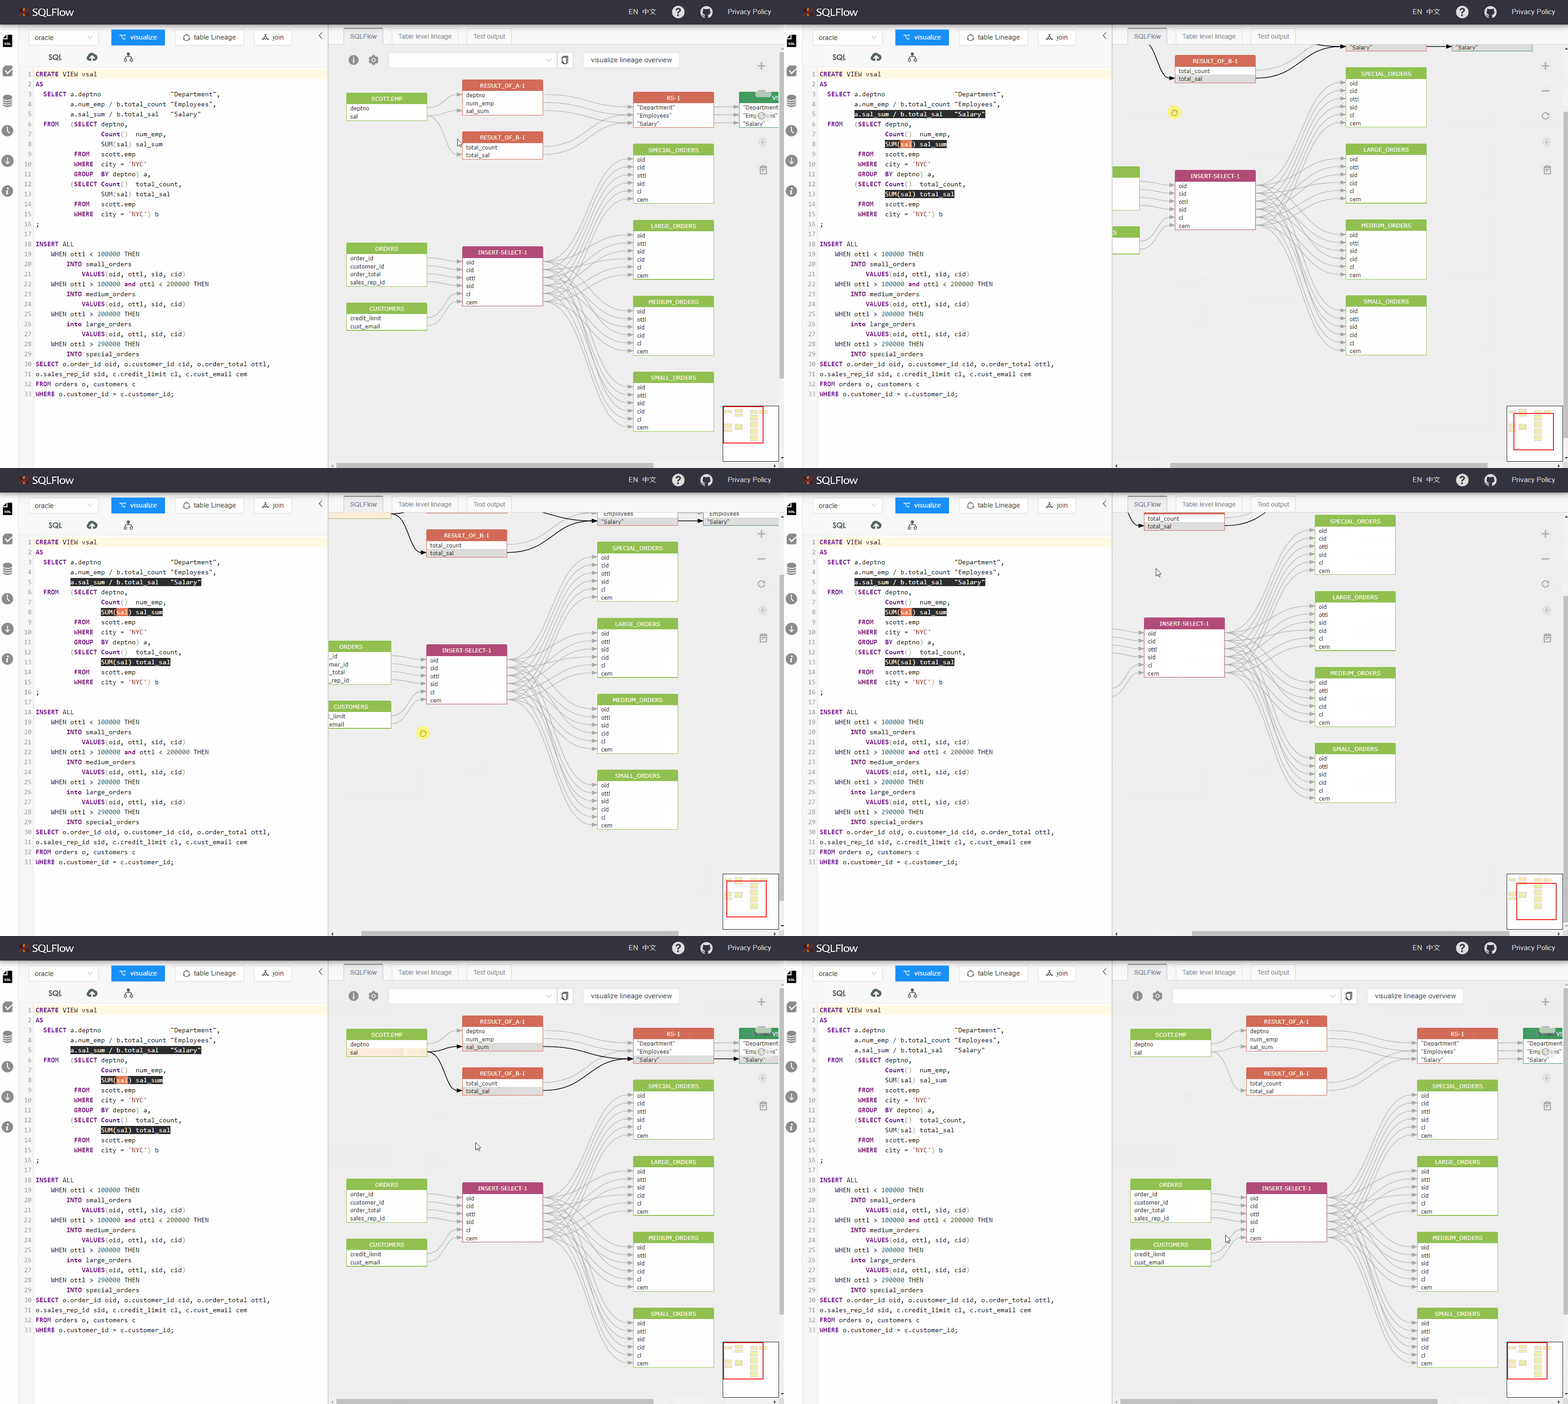
SQLText Editor
Enter your SQL code in the live editor. You can choose the database under the section of dbvendor. Visualize your data lineage by clicking visualize or visualize join.
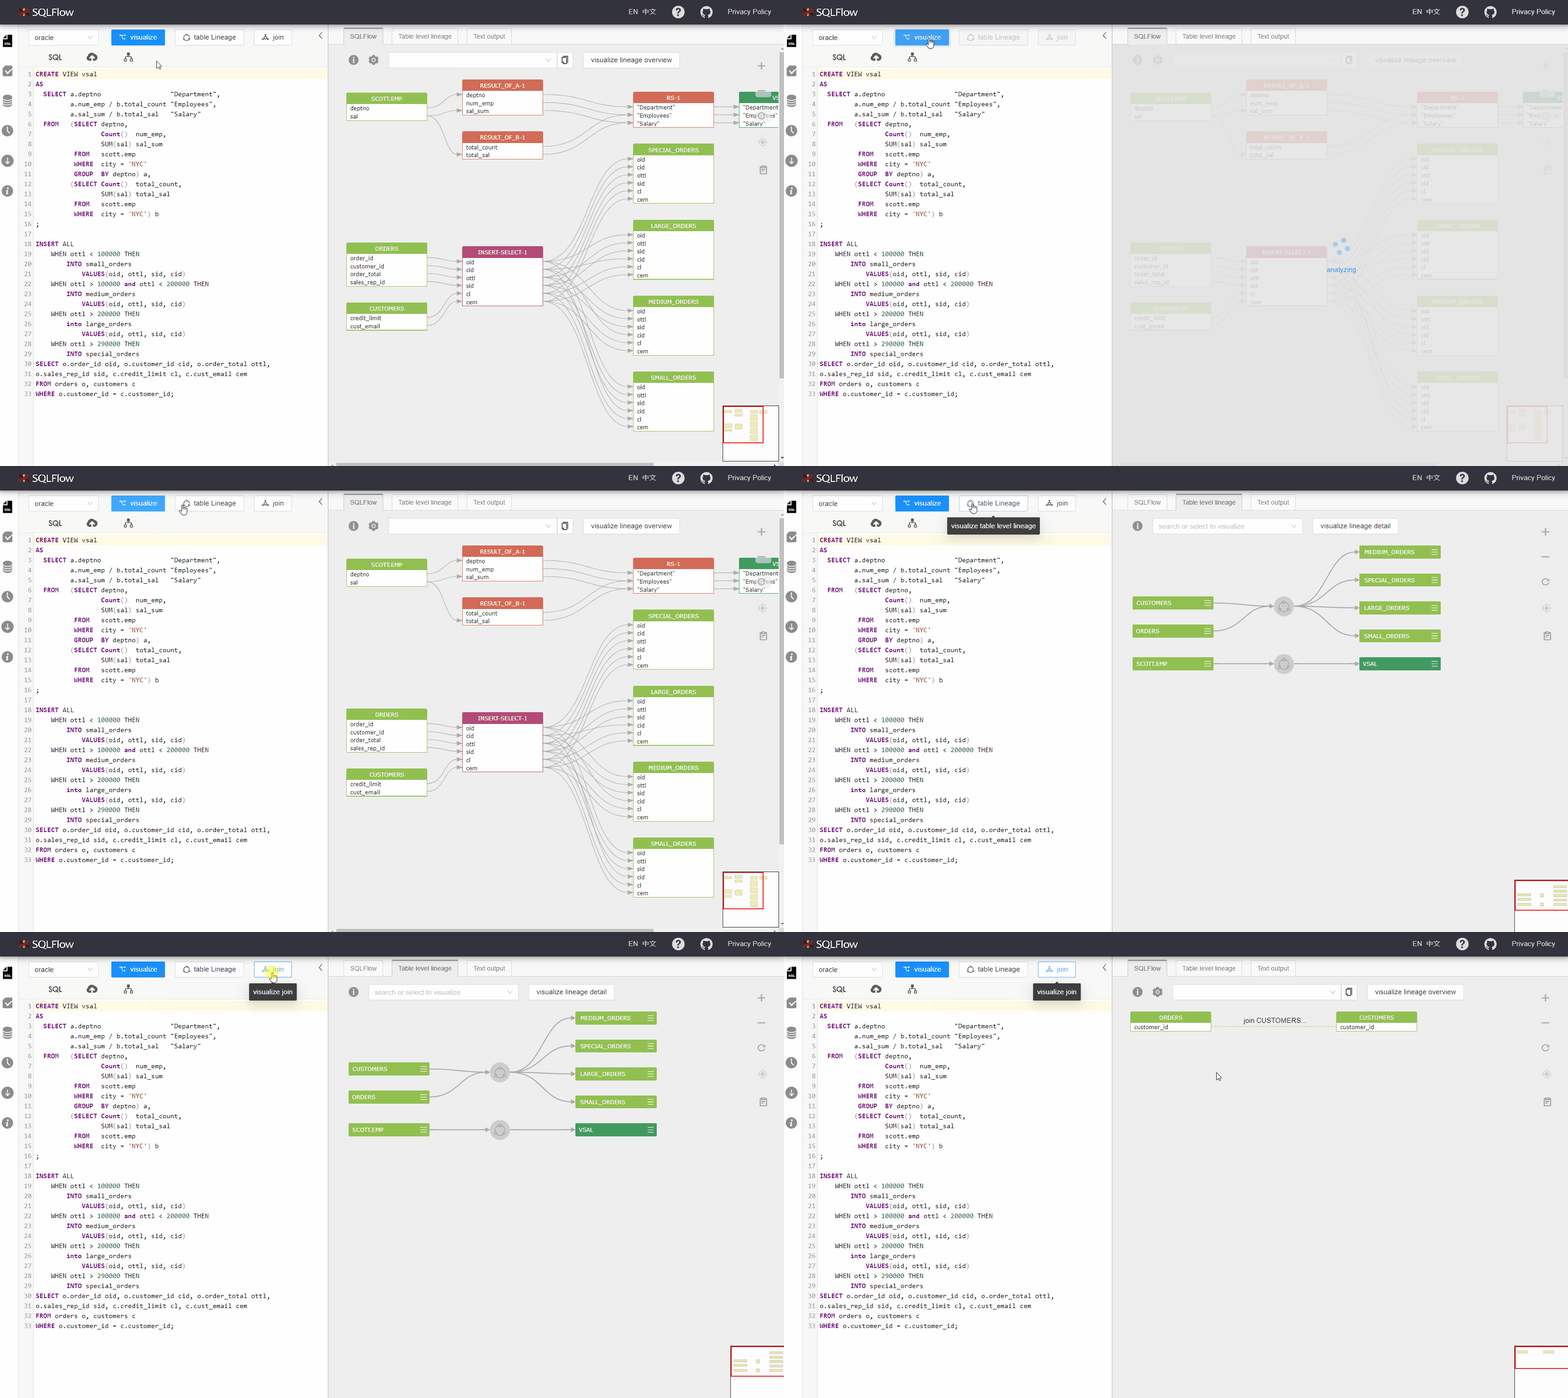
Table level lineage
Click Table Lineage to show only table level lineage. UI invokes /sqlflow/graph/table_level_lineage to get the table level lineage result. The /sqlflow/graph/table_level_lineage returns the simplified data lineage result with only table level information.
Table level lineage has almost the same structure as column level lineage. The only difference is instead of pointing to table, the source block or the target block will point to process.
Example:
1 | |
will become
1 | |
You can read more about relationship, source, target here.
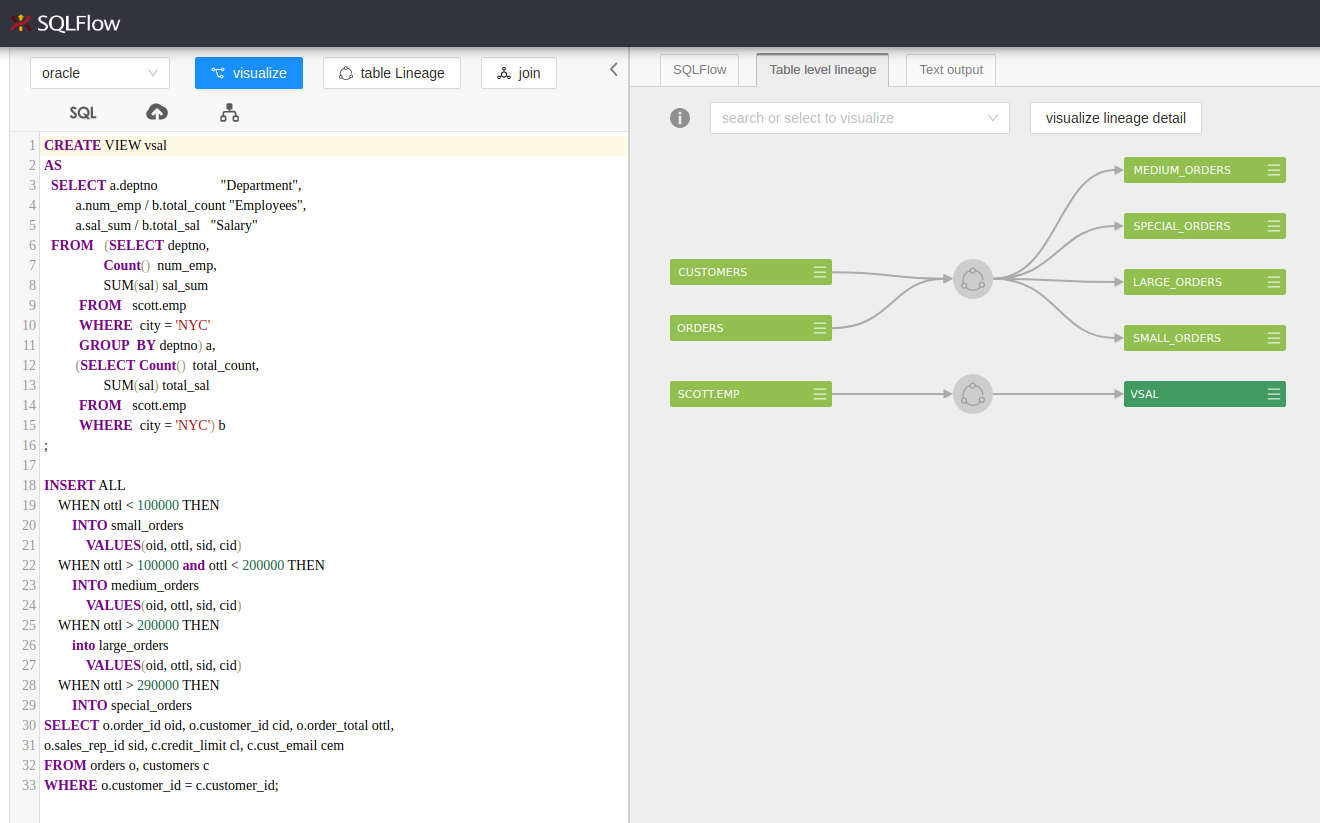
table level lineage
Check source sql code under table level lineage
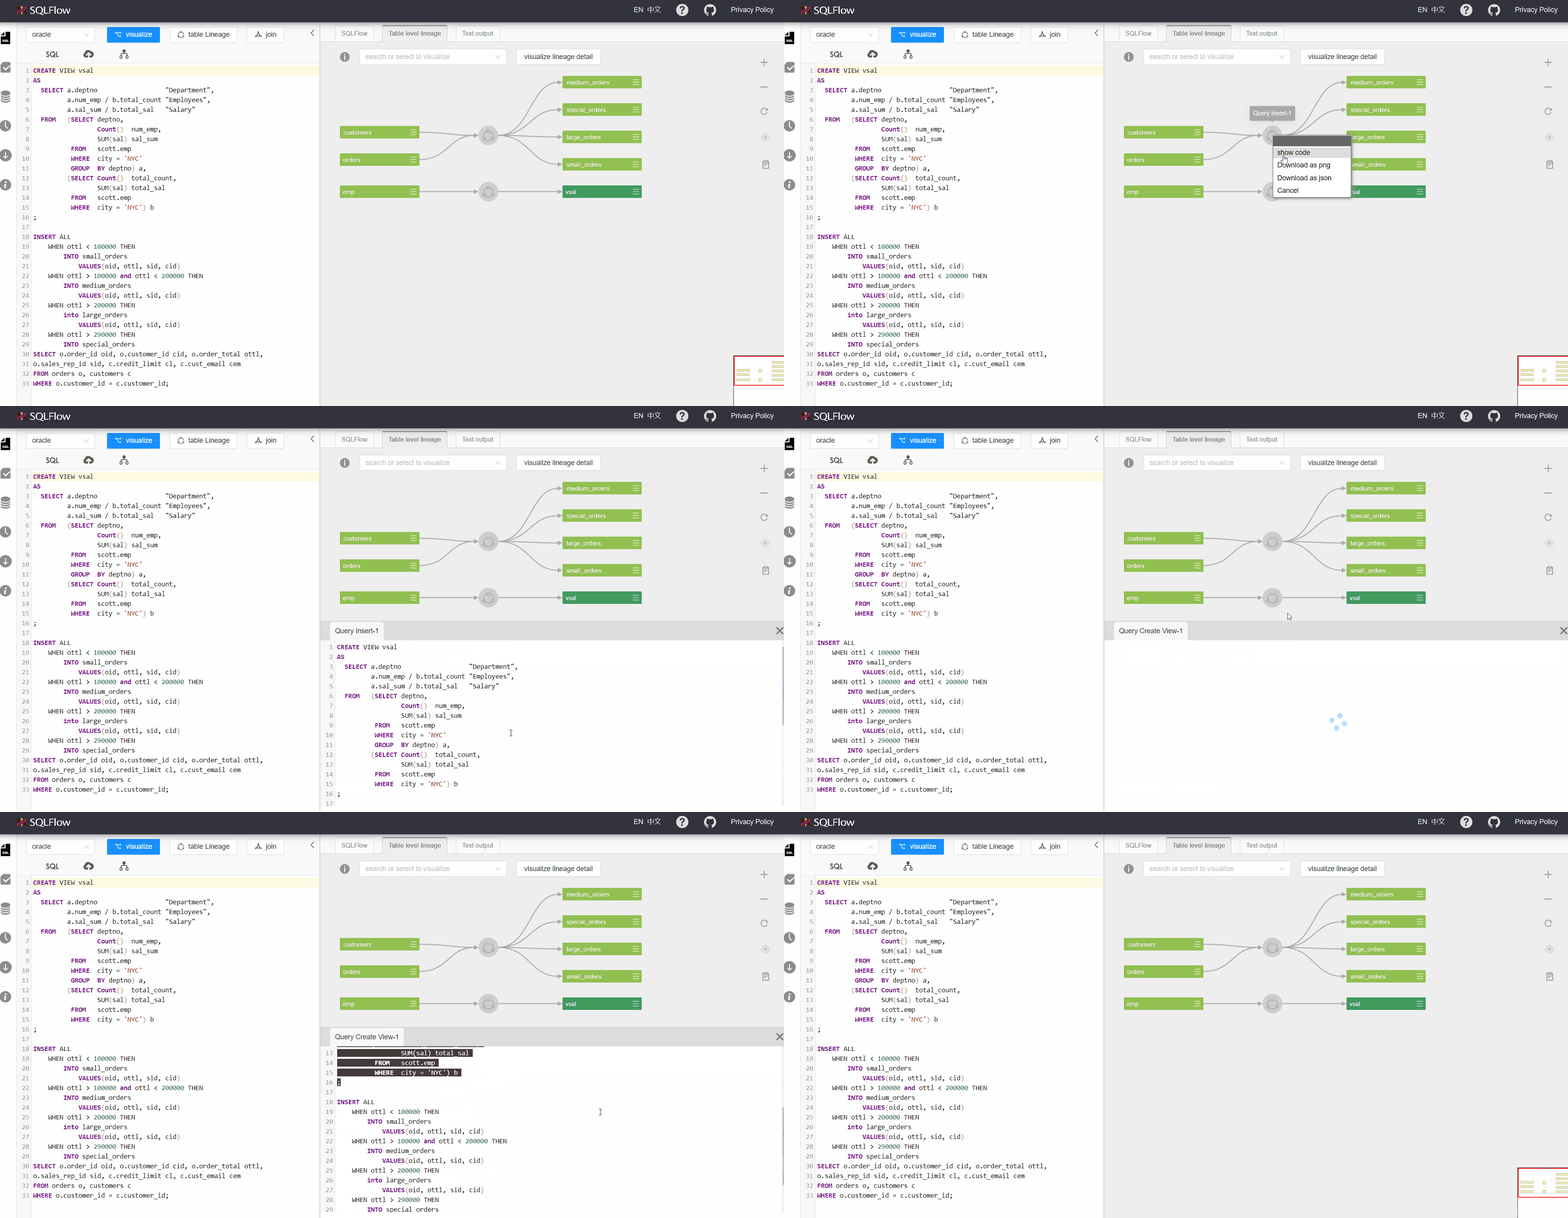
Visualize join
When clicking visualize, a sqlflow model will be generated and the UI will display the data lineage based on the sqlflow model response. A request to /sqlflow/generation/sqlflow/graph will be made with fdd as the value of the field showRelationType and true in ignoreFunction.
When clicking visualize join, same endpoint (/sqlflow/generation/sqlflow/graph) will be invoked as above. We will have join as the value of the field showRelationType and true for ignoreFunction in the request.
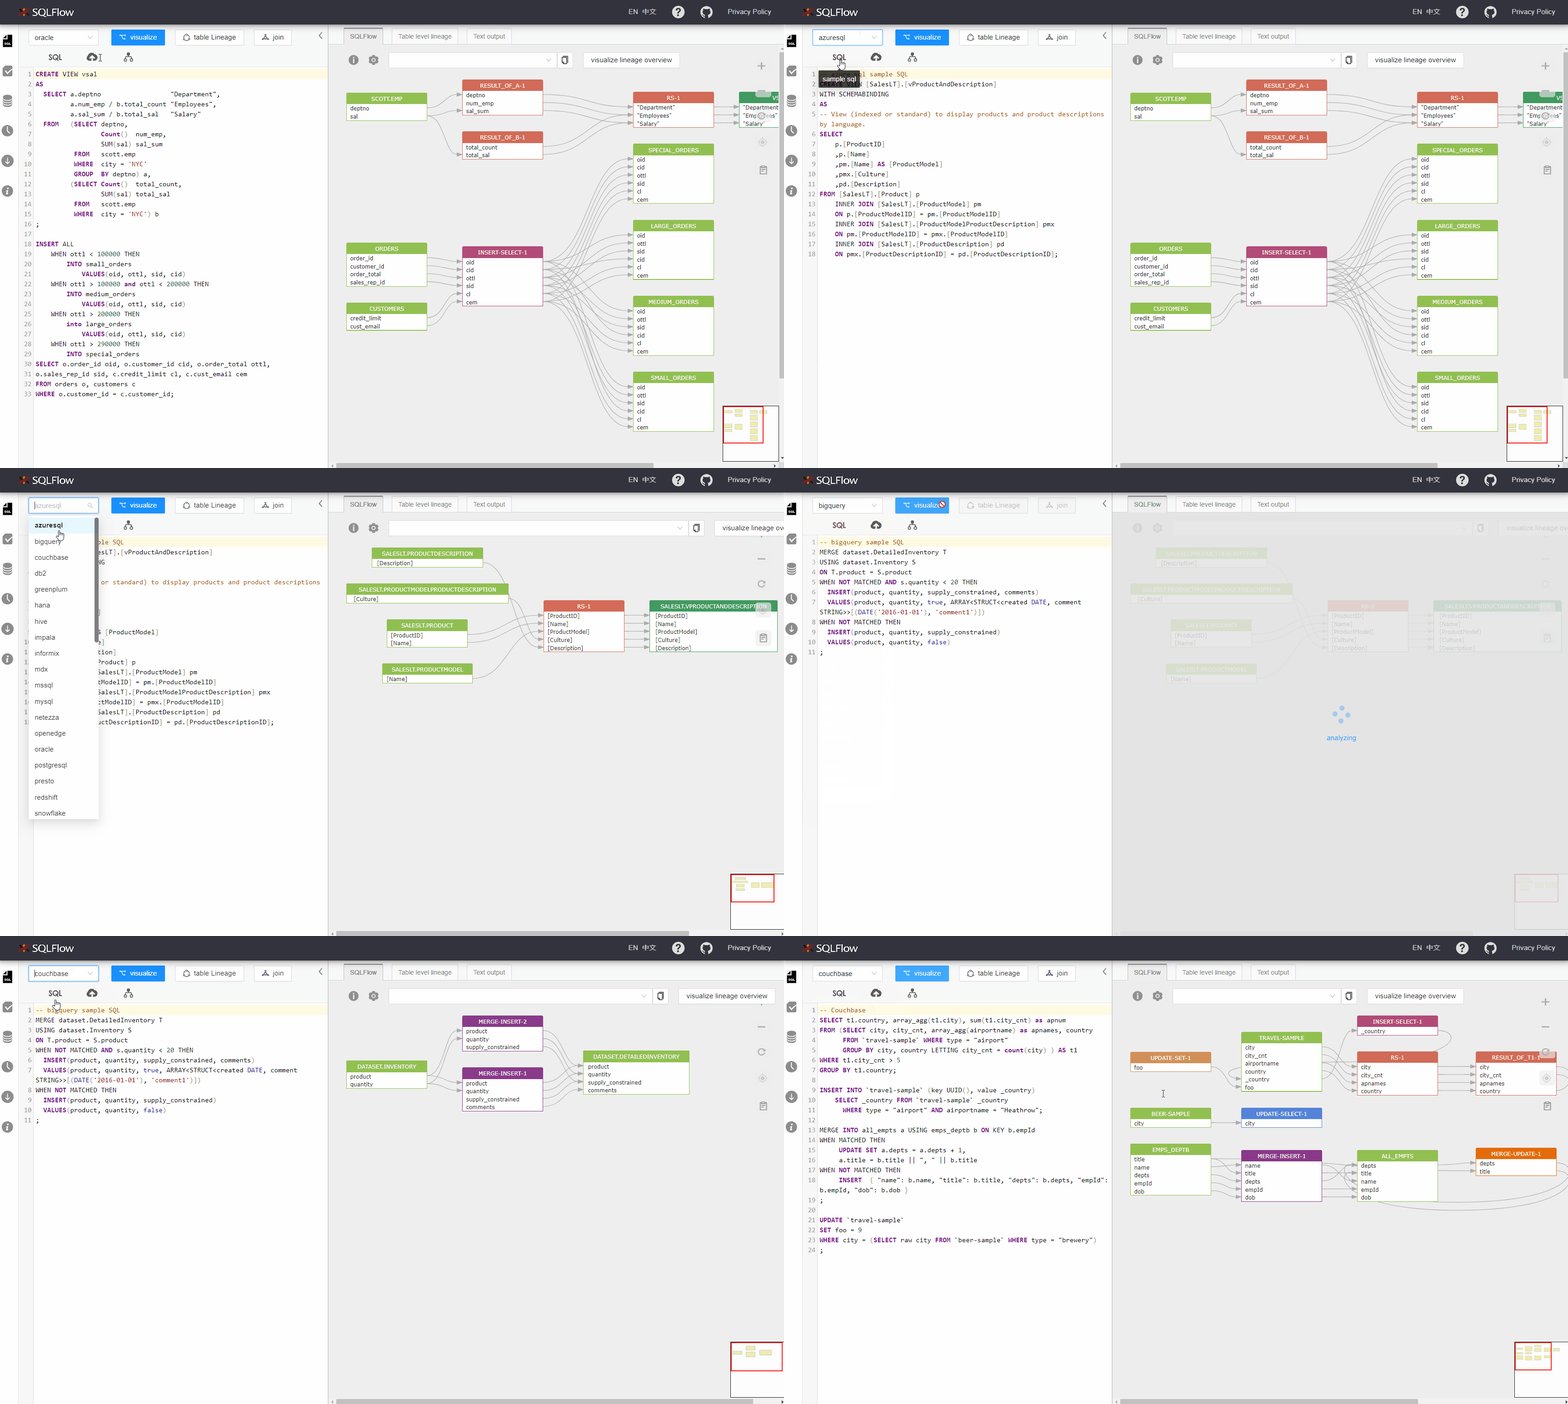
Switch sample SQL
Click the dbvendor menu and select the database. Click sample SQL to get the sample sql corresponding to this dbvendor in the live editing box.
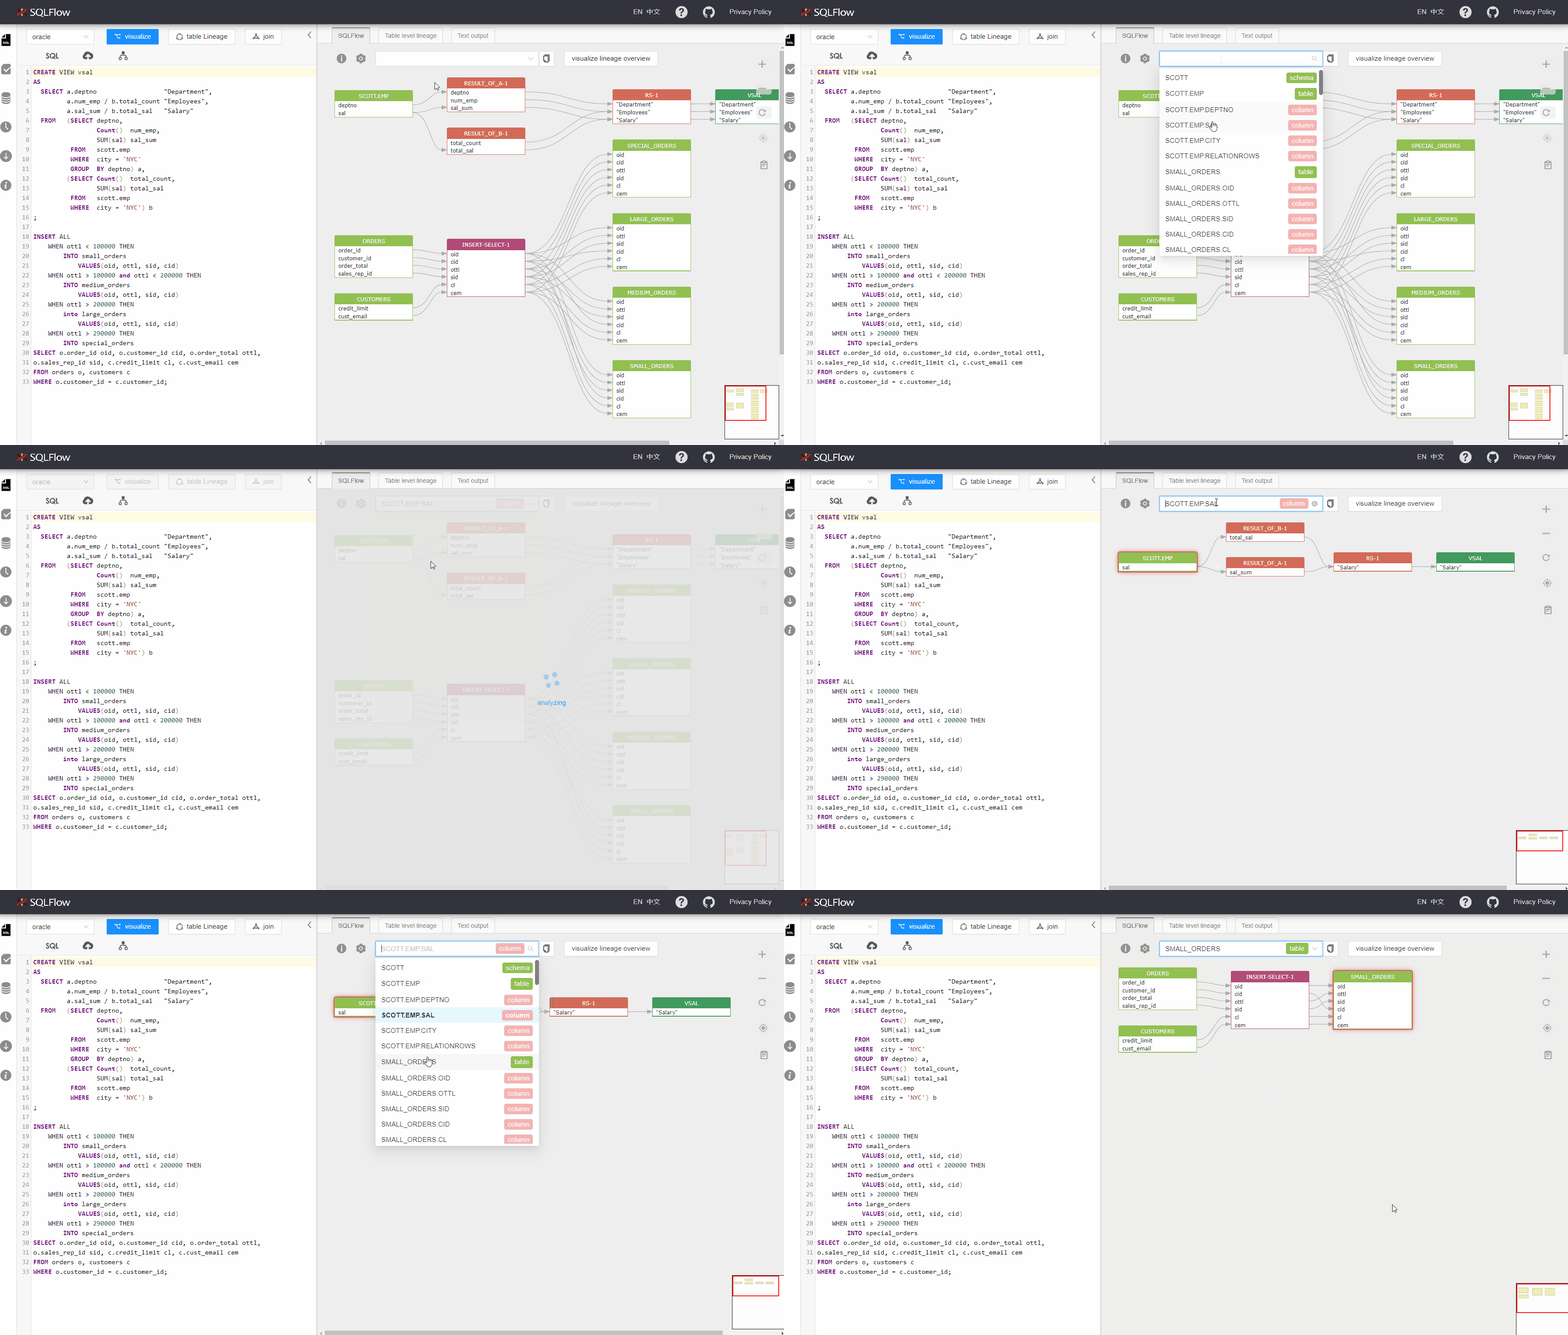
Visualize a column or table by dropdown menu
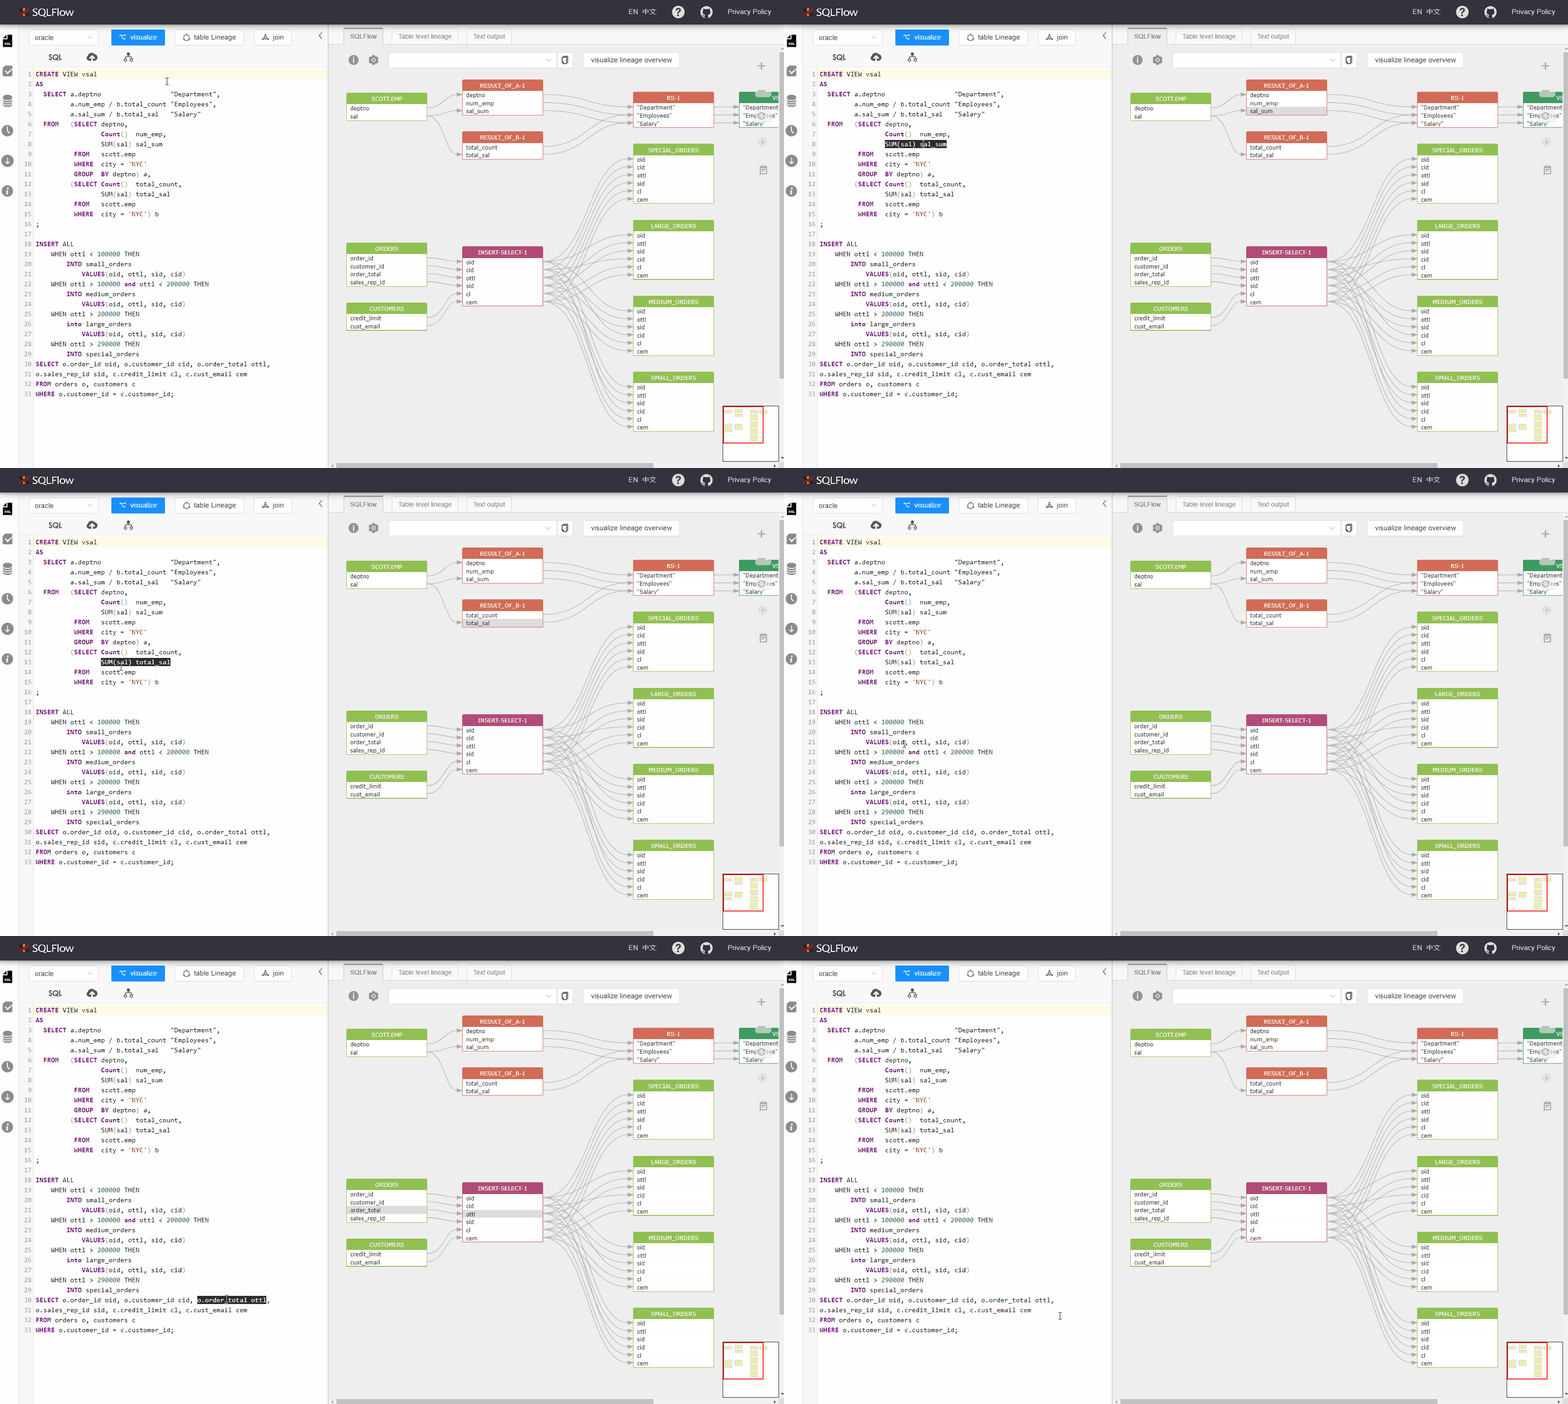
Hover sqltext to highlight graph
Hover over sqltext to find the corresponding graph.
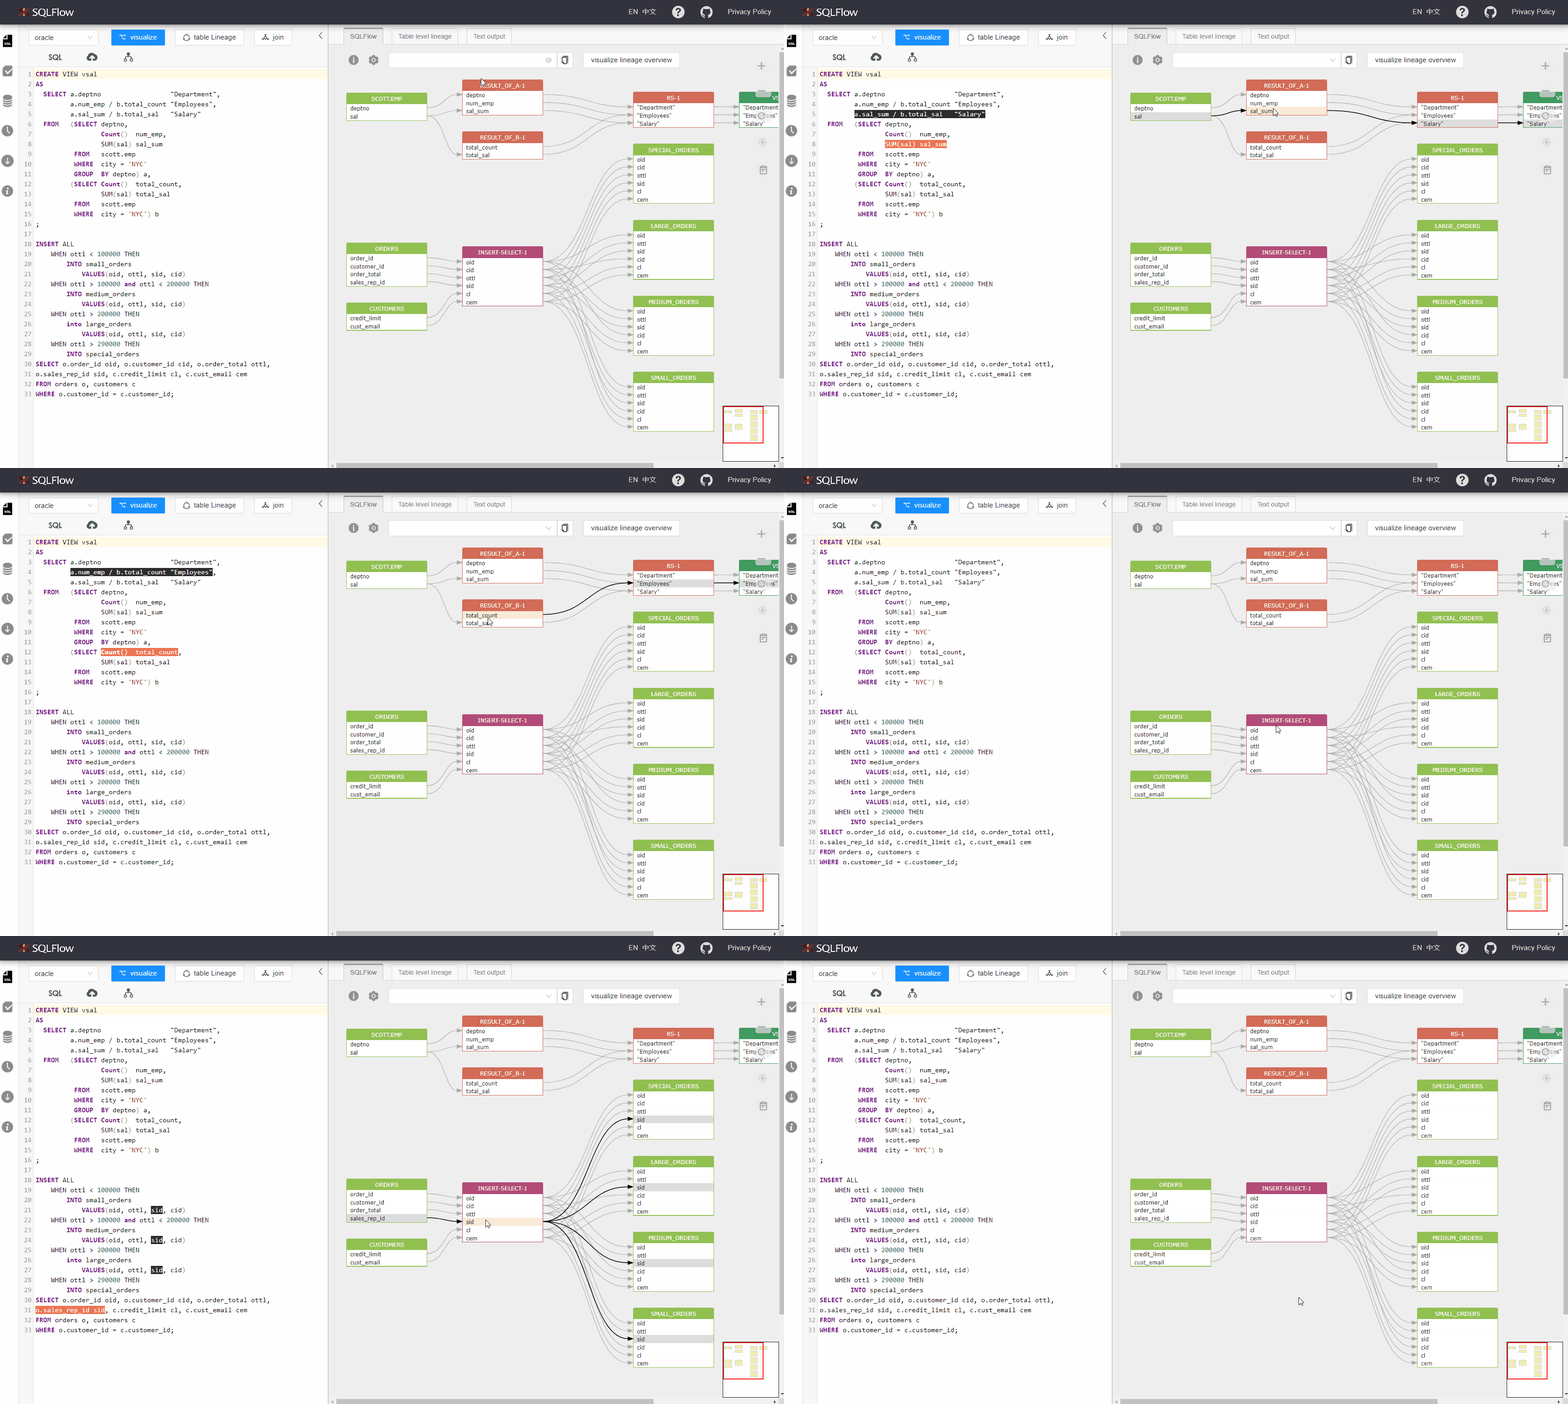
Hover graph to highlight sqltext
Hover over graph to find the corresponding sqltext.
Resize left panel width
Hover over the edge of the panel. You can drag and change the width when there is a highlight.
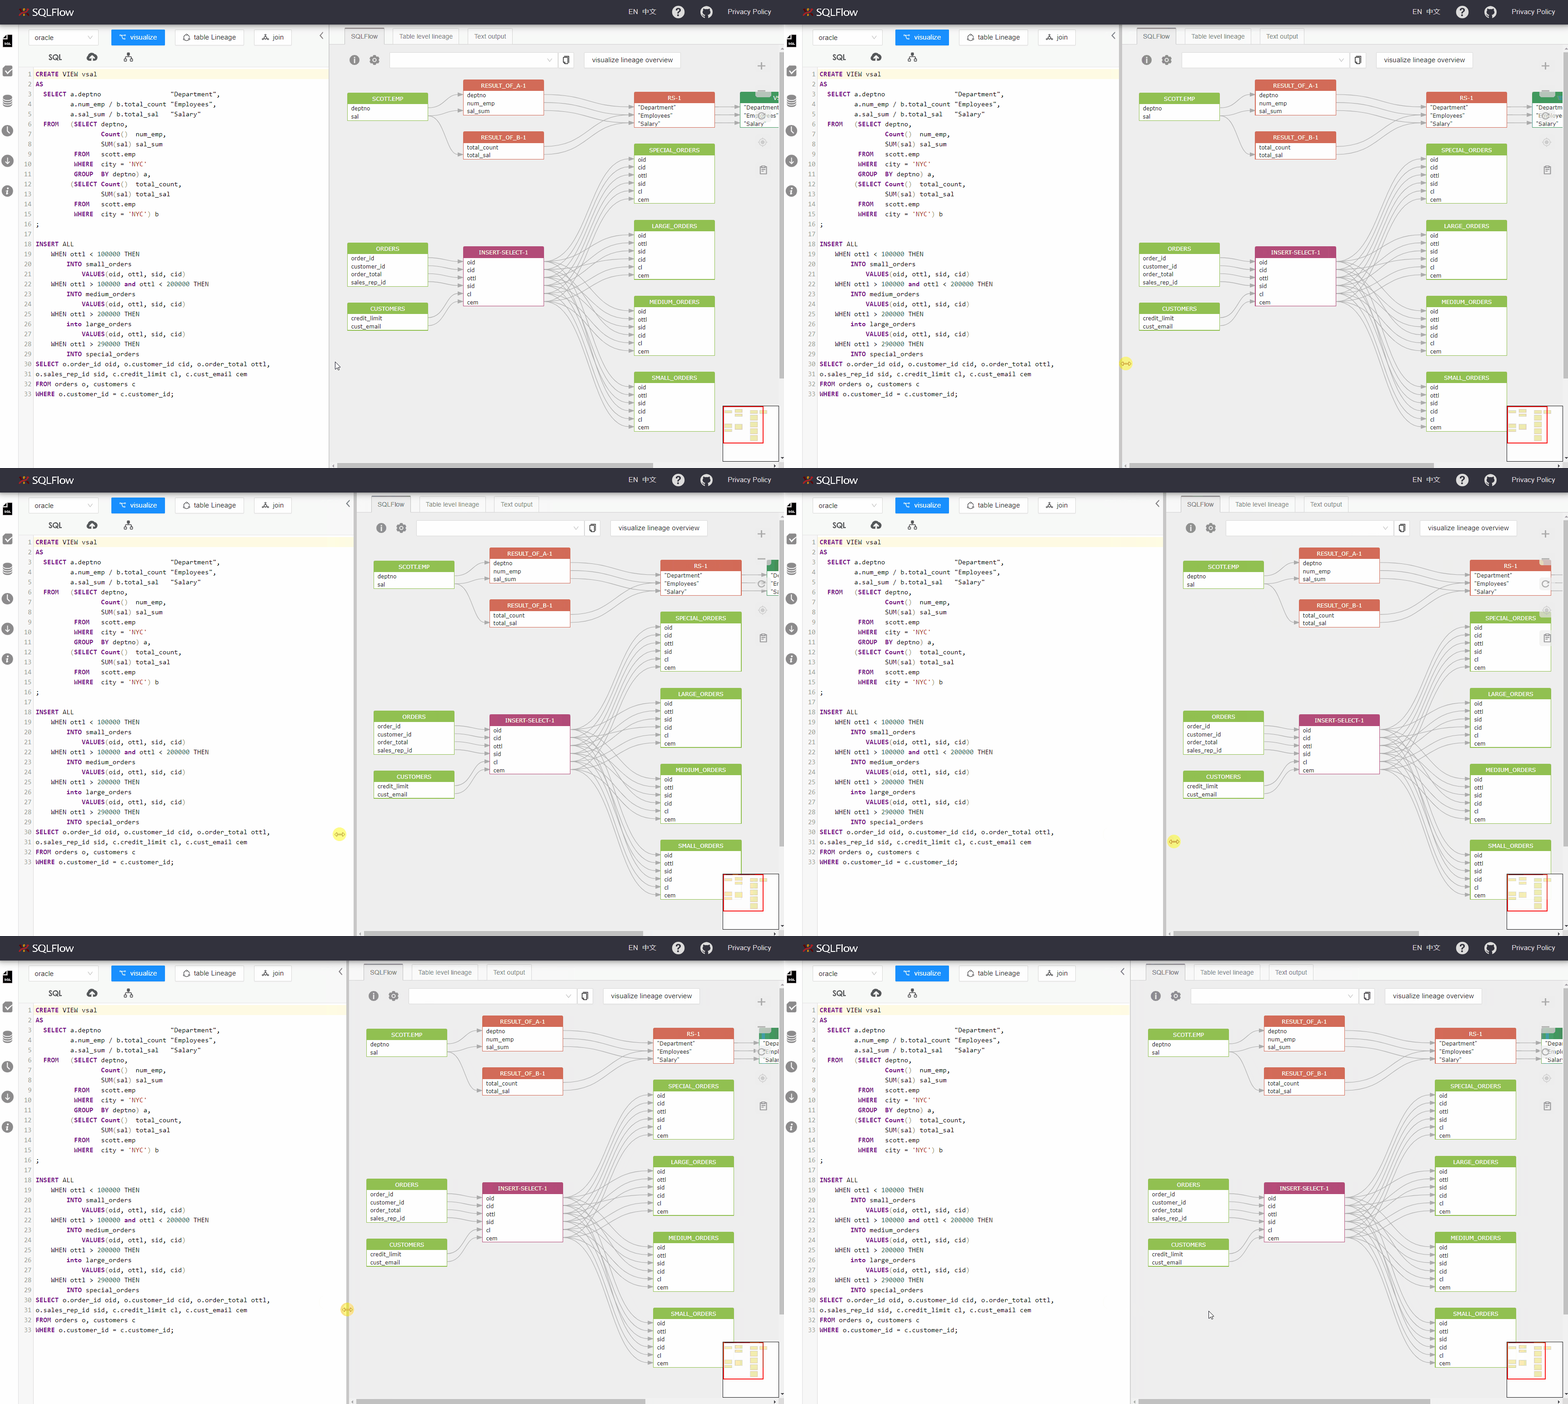
Pin graph, drag graph, and cancel
Click a column in the graph to fix the upstream and downstream relationships. Press and hold down the left mouse button to move the canvas.
